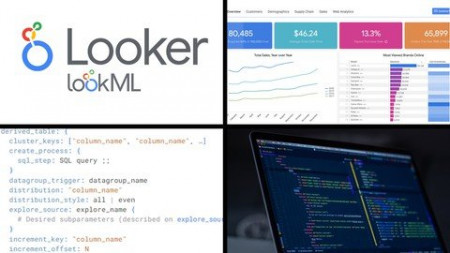
• Regeln für den Video-Bereich:

    In den Börsenbereich gehören nur Angebote die bereits den Allgemeinen Regeln entsprechen.

    Einteilung

    - Folgende Formate gehören in die angegeben Bereiche:
    - Filme: Encodierte Filme von BluRay, DVD, R5, TV, Screener sowie Telesyncs im Format DivX, XviD und x264.
    - DVD: Filme im Format DVD5, DVD9 und HD2DVD.
    - HD: Encodierte Filme mit der Auflösung 720p oder darüber von BluRay, DVD, R5, TV, Screener sowie Telesyncs im Format x264.
    - 3D: Encodierte Filme von BluRay, die in einem 3D Format vorliegen. Dies gilt auch für Dokus, Animation usw.
    - Serien: Cartoon/Zeichentrick, Anime, Tutorials, Dokumentationen, Konzerte/Musik, Sonstiges sind demnach in die entsprechenden Bereiche einzuordnen, auch wenn sie beispielsweise im High Definition-Format oder als DVD5/DVD9/HD2DVD vorliegen. Ausnahme 3D.
    - Bereich Englisch: Englische Releases gehören immer in diesen Bereich.
    - Bereich Talk: Der Bereich, in dem über die Releases diskutiert werden kann, darf, soll und erwünscht ist.


    Angebot/Beitrag erstellen

    - Ein Beitrag darf erst dann erstellt werden, wenn der Upload bei mindestens einem OCH komplett ist. Platzhalter sind untersagt.
    - Bei einem Scenerelease hat der Threadtitel ausschließlich aus dem originalen, unveränderten Releasenamen zu bestehen. Es dürfen keine Veränderungen wie z.B. Sterne, kleine Buchstaben o.ä. vorgenommen werden. Ausnahme Serienbörse:
    - Bei einem Sammelthread für eine Staffel entfällt aus dem Releasename natürlich der Name der Folge. Beispiel: Die Simpsons S21 German DVDRip XviD - ITG
    - Dementsprechend sind also u.a. verboten: Erweiterungen wie "Tipp", "empfehlenswert", "only", "reup", usw. / jegliche andere Zusatzinformation oder Ergänzung, welche nicht in obiger Beschreibung zu finden ist.

    Aufbau des Angebots und Threadtitel

    Der Titel nach folgendem Muster erstellt zu werden. <Name> [3D] [Staffel] [German] <Jahr> <Tonspur> [DL] [Auflösung] <Quelle> <Codec> - <Group>
    Beispiel: The Dark Knight German 2008 AC3 DVDRip XviD - iND
    Beispiel: The Dark Knight 2008 DTS DL BDRip x264 - iND
    Beispiel: The Dark Knight 2008 AC3 DL BDRip XviD - iND
    Beispiel: The Dark Knight German 2008 AC3 720p BluRay x264 iND
    Beispiel: The Dark Knight 2008 DTS DL 1080p BluRay x264 iND
    Beispiel: Die Simpsons S01 German AC3 DVDRip XviD iND
    Beispiel: Die Simpsons S20 German AC3 720p BluRay x264 iND
    Beispiel: Sword Art Online II Ger Sub 2014 AAC 1080p WEBRip x264 - peppermint
    Entsprechend sind also u.a. verboten: Sonderzeichen wie Klammern, Sterne, Ausrufezeichen, Unterstriche, Anführungszeichen / Erweiterungen wie "Tipp", "empfehlenswert", "only", "reup", usw. / jegliche andere Zusatzinformation oder Ergänzung, welche nicht in obiger Beschreibung zu finden ist
    Ausnahmen hiervon können in den Bereichen geregelt sein.

    Die Beiträge sollen wie folgt aufgebaut werden:
    Überschrift entspricht dem Threadtitel
    Cover
    kurze Inhaltsbeschreibung
    Format, Größe, Dauer sind gut lesbar für Downloader außerhalb des Spoilers zu vermerken
    Nfo sind immer Anzugeben und selbige immer im Spoiler in Textform.
    Sind keine Nfo vorhanden z.B. Eigenpublikationen, sind im Spoiler folgende Dateiinformationen zusätzlich anzugeben :
    Quelle
    Video (Auflösung und Bitrate)
    Ton (Sprache, Format und Bitrate der einzelnen Spuren)
    Untertitel (sofern vorhanden)
    Hosterangabe in Textform außerhalb eines Spoiler mit allen enthaltenen Hostern.
    Bei SD kann auf diese zusätzlichen Dateiinformationen verzichtet werden.

    Alle benötigten Passwörter sind, sofern vorhanden, in Textform im Angebot anzugeben.
    Spoiler im Spoiler mit Kommentaren :"Schon Bedankt?" sind unerwünscht.


    Releases

    - Sind Retail-Release verfügbar, sind alle anderen Variationen untersagt. Ausnahmen: Alle deutschen Retail-Release sind CUT, in diesem Fall sind dubbed UNCUT-Release zulässig.
    - Im Serien-Bereich gilt speziell: Wenn ein Retail vor Abschluss einer laufenden Staffel erscheint, darf diese Staffel noch zu Ende gebracht werden.62
    - Gleiche Releases sind unbedingt zusammenzufassen. Das bedeutet, es ist zwingend erforderlich, vor dem Erstellen eines Themas per Suchfunktion zu überprüfen, ob bereits ein Beitrag mit demselben Release besteht. Ist dies der Fall, ist der bereits vorhandene Beitrag zu verwenden.
    - P2P und Scene Releases dürfen nicht verändert oder gar unter einem iND Tag eingestellt werden.


    Support, Diskussionen und Suche

    - Supportanfragen sind entweder per PN oder im Bereich Talk zu stellen.
    - Diskussionen und Bewertungen sind im Talk Bereich zu führen. Fragen an die Uploader haben ausschließlich via PN zu erfolgen, und sind in den Angeboten untersagt.
    - Anfragen zu Upload-Wünschen sind nur im Bereich Suche Video erlaubt. Antworten dürfen nur auf Angebote von MyBoerse.bz verlinkt werden.


    Verbote

    - Untersagt sind mehrere Formate in einem einzigen Angebotsthread, wie beispielsweise das gleichzeitige Anbieten von DivX/XviD, 720p und 1080p in einem Thread. Pro Format, Release und Auflösung ist ein eigener Thread zu eröffnen.
    - Grundsätzlich ebenso verboten sind Dupes. Uploader haben sich an geeigneter Stelle darüber zu informieren, ob es sich bei einem Release um ein Dupe handelt.
    - Gefakte, nur teilweise lauffähige oder unvollständige Angebote sind untersagt. Dies gilt auch für eigene Publikationen, die augenscheinlich nicht selbst von z.B. einer DVD gerippt wurden. Laufende Serien, bei denen noch nicht alle Folgen verfügbar sind, dürfen erstellt und regelmäßig geupdatet werden.
    - Untersagt sind Angebote, welche nur und ausschließlich in einer anderen Sprache als deutsch oder englisch vorliegen. Ausnahmen sind VORHER mit den Moderatoren zu klären.


    Verstoß gegen die Regeln

    - Angebote oder Beiträge, die gegen die Forenregeln verstoßen, sind über den "Melden"-Button im Beitrag zu melden.
  • Bitte registriere dich zunächst um Beiträge zu verfassen und externe Links aufzurufen.


Englische Tutorials

Blazor WebAssembly Full Stack Bootcamp with .NET 5

0086c248ppk9n.jpg


Blazor WebAssembly Full Stack Bootcamp with .NET 5
MP4 | Video: h264, 1280x720 | Audio: AAC, 44.1 KHz, 2 Ch
Genre: eLearning | Language: English + srt | Duration: 211 lectures (17h 33m) | Size: 5 GB

Build an online browser game from scratch using Blazor WebAssembly, Web API, Entity Framework & SQL Server with .NET 5

What you'll learn:
Build a complete web application with Blazor WebAssembly, Web API, Entity Framework and a SQL Server database
Razor components: Communication, data binding, event handling, the @code block & more
Forms in Blazor WebAssembly with Validation & displaying validation messages
Utilize built-in forms components like InputText, InputCheckbox, InputSelect & more
Authentication & authorization with the AuthenticationStateProvider & the AuthorizeView component
Authentication with JSON Web Tokens (JWT)
Use Web API as web service with the HTTP request methods GET, POST, PUT & DELETE by utilizing the Model-View-Controller (MVC) pattern
Use Entity Framework with code-first migrations to store your data in a SQL Server database
Publish & Deploy to a Windows Server with IIS (Internet Information Services)
...and much more!

Requirements
Basic web development knowledge with C# & HTML is preferable


Description
Blazor WebAssembly is turning the web development world upside down.

With Blazor you can keep coding every part of your web application - meaning front end and back end - with the programming language and the framework you love - C# and .NET.

No need for JavaScript anymore and you can even use the same classes and methods you write for the server as well as for the client.

We will dive right into the code by first having a look at the standard example project of Blazor WebAssembly and then we already build the main project of this course, which is a classic online browser game, where users can create an army of fighters and send them into battle against other users.

Together with some customization options and climbing the leaderboard, this application will teach you how to use Blazor WebAssembly with Razor components in a playful way.

We will have a look at data- and event binding, communication between components, forms with their built-in components and validation options, how to use views only authorized users can see, how to make calls to a web service, and much more.

Additionally, you will learn how to build the back end of the browser game with a Web API and Entity Framework to store all the data in a SQL Server database.

By the end of this course, you will have what it takes to call yourself a full stack Blazor web developer.

With your new skills, you are ready to conquer any upcoming .NET web development project you want to build yourself or any project that is requested by a recruiter.

The only tools you need are Visual Studio, Postman, SQL Server, and a browser like Chrome or Firefox.

Everything is available for free and also cross-platform! So you can follow this course on Windows and macOS.

What You Will Learn

Introduction & Jumpstart

Create an ASP.NET Core hosted Blazor WebAssembly project

Examine the example project

Explore different ways to run your web application

Debug client & server code at the same time

Initialize a Git repository for your source control

Blazor WebAssembly Fundamentals

Create Razor components

Write C# code and HTML in the same file

The @code block

Component communication with parameters, event callbacks & services

Data binding & event handling

Add pages to your Blazor WebAssembly application

Routing & navigation in a Blazor app

Create and use models within your web application

Loops & more in Razor components

User feedback with toaster messages for errors & more

Manage NuGet Packages

Forms & Authentication

Create forms with validations

Use all built-in forms components like InputText, InputCheckbox, InputSelect & more

Build login & registration forms

Display validation errors

Utilize models with forms

Add the NavigationManager to navigate the user in your app

Utilize the AuthenticationStateProvider

Expose the AuthenticationState

Use the AuthorizeView component

Page restriction with the [Authorize] attribute

Use the LocalStorage for authentication

Web API & Entity Framework

The Model-View-Controller (MVC) pattern

Create models and controllers

Use the same models for the server and the client

Attribute routing (with parameters)

The HTTP request methods GET, POST, PUT & DELETE

Object-Relational-Mapping

Code-First Migration

SQL Server

How to use a DataContext and a proper ConnectionString

All previous HTTP requests with Entity Framework to save your data in a SQL Server database

Inspect your database with the SQL Server Management Studio

Authentication with JSON Web Tokens (JWT)

Create & verify JSON Web Tokens

Use the Repository pattern

Add & read claims

Secure controllers with the Authorize attribute

Use the JWT in the AuthenticationStateProvider of Blazor WebAssembly

Advanced Blazor WebAssembly, Web API & Entity Framework Implementations

Add relations to your database

Use LINQ functions to Select, Order & Include entities

Complete the game logic: Grow your army, fight battles, climb the leaderboard

...and more!

Publish & Deploy your Web Application

Deploy your web application on a Windows Server with IIS (Internet Information Services)

User the Web Deploy feature of IIS to publish and deploy your app with Visual Studio

Your Instructor

My name is Patrick and I will be your instructor in this course. I'm a web developer for over a decade now, I have worked for big corporations and small teams, as an employee and a contractor and I just love to see the way Microsoft is going with .NET & Blazor and how important these technologies get day by day.

To this date, I was able to run seven courses on web development here on Udemy about .NET (Core), Blazor, single-page applications, Angular and DevOps - with a total of over 55.000 unique students and over 6.000 reviews.

If you have any questions, feel free to connect.

And if you still have any doubts, you have a 30-day money-back guarantee, no questions asked.

Are you ready to take the next step in web development?

I'm looking forward to seeing you in the course!

Course image: vector illustration/Shutterstock

Who this course is for
Everyone who wants to make the next big step in web development with Blazor & .NET
Students who want to improve their skills in order to have better chances for career advancement

Homepage


003exampleprojectexpleuk77.jpg


The Microsoft Excel Analyst Bootcamp

irzlpzkox6aywyhnl1vkpqjkcv.jpg


The Microsoft Excel Analyst Bootcamp
Created by Travis Cuzick | Last updated 8/2021
Duration: 13h 6m | 14 sections | 85 lectures | Video: 1280x720, 44 KHz | 5 GB
Genre: eLearning | Language: English + Sub

The most efficient way to master the Excel skills you need to be an office Rockstar!


What you'll learn
Keyboard shortcuts and data entry tips and tricks
Filtering, sorting, and formatting your data
Manipulating date and time data with functions like DATE, TIME, DATEDIF, and NETWORKDAYS
Transforming and cleaning text data with functions like LEFT/RIGHT, MID, FIND, SUBSTITUTE, and TRIM
Applying conditional logic with the IF, AND, and OR functions
Using VLOOKUP to consolidate and reconcile separate datasets
Building dynamic models with Excel
Applying conditional formatting, color scales, and data bars to give meaning to your data
Using Excel's powerful charting engine to tell the story of your data with attractive visualizations
Working with external data
Managing structured datasets efficiently with Excel Tables
Summarizing and analyzing large datasets with Excel Pivot Tables
Supercharging your Pivot Tables with Slicers
Automating Excel with VBA Macros
Show more
Show less

Requirements
An installation of Microsoft Excel (Excel 365 is used for demonstrations, but the course material is compatible with earlier versions).Excel for Mac should be fine in most cases, but all course examples are presented on Windows.

Description
Whether you're an Analyst who works with data for a living, or one of the millions of people in offices all over the world who find themselves spending more time wrestling with spreadsheets than doing their actual job, chances are excellent that you can supercharge your productivity - and decrease your stress - by mastering Microsoft Excel.
Excel allows us to transform, analyze, summarize, and visualize our data with incredible power and efficiency, making it the ultimate "glue" application without which many organizations would fall apart. You'd be amazed at how much many crucial decisions made at the highest levels of companies, or even governments, are made based on data in an Excel spreadsheet.
And even better - with the right teaching approach - Excel is actually pretty easy to master.
Now to be sure, Excel is one of the most complex applications ever built, and a course that covers all of its features and functionality might last well into the next decade. But fortunately, as with so many things, there is a small percentage of Excel's feature set that most people use, most of the time.
Because I want to level up your skills in the shortest time possible, this course is laser-focused on Excel's most useful and powerful features - the ones you'll find yourself going back to, day in and day out.
\n
\n
Here's a sneak peek at just some of the things you'll learn:
Keyboard shortcuts and data entry tricks that will help you swat away those tedious tasks around the office with ease
Formatting tips to give your spreadsheets that professional look
Filtering and sorting for rapid insights into your data
Crunching out calculations and summary statistics with Excel formulas and functions
Performing "date math" with Excel's vast array of date and time functions
Using functions to perform complex operations on text data
Logical functions like AND, OR, and IF for advanced conditional operations
Master the essential VLOOKUP function for consolidating and reconciling separate datasets
Best practices for constructing dynamic models with sophisticated controls for varying model input
Advanced data visualization techniques, including custom formats, conditional formatting, and - of course! - charts
Working with external data
Managing "structured" data efficiently with Excel Tables
Condensing large datasets into powerful Business Intelligence using Excel Pivot Tables
Taking your Pivot Tables to the next level with Slicers
Automating redundant tasks with Excel Macros
Editing VBA (Visual Basic for Applications) code for more fine-tuned control of your Macros

4.scrollbarss6bkbl.jpg


Rank, Map & Chart Covid19 Countries with Next.js

cz43fivsfedyn3b7rr745t1k9w.jpg


Rank, Map & Chart Covid19 Countries with Next.js
MP4 | Video: h264, 1280x720 | Audio: AAC, 44.1 KHz, 2 Ch
Genre: eLearning | Language: English + srt | Duration: 10 lectures (2h 11m) | Size: 1.14 GB

Learn to work with React's Next.js, while combining it with an external API to map, graph & display data about Covid19

What you'll learn:
Learn how to use Nextjs (React framework)
Working with getServerSideProps and understanding the difference with getStaticProps
Understanding dynamic pages within Nextjs
Using an external API and working with the data
Learn how to make a map with data in Nextjs with Leaflet
Graph your data with Chartjs
Deploy your application with Vercel

Requirements
No requirements. Ideally it will help a little if you know some vanilla React, but complete beginners are welcome!


Description
Students will learn how to use Nextjs (React framework), including working with getServerSideProps, learning what separates it from getStaticProps, implement dynamic pages, along with accessing an external API based on the latest Covid19 information to output and work with the data which the finalized application will be deployed to a website on Vercel.

Users will also gain valuable knowledge on how to work with location data, outputting co-ordinates on a map using Leaflet within our Next.js application and showing the steps required to get it up and running, which can otherwise be a hassle to figure out.

We will also understand how to use and graph data in our Next.js application with Chart.js, showing the past daily instances of infections of the past month.

We will also utilize some CSS in order to style and layout the page in a nice, clean and presentable manner.

While this tutorial is for a Covid19 website, I would strongly advise that people who are following along try to change it into something they prefer, like shoes, toys, anime, cars - anything, or even output the data in a different way - as it will help cement their learning, and fundamentally this is to get a better understanding of working with Next.js, array filtering and data manipulation, as the data itself can be used with any available APIs.

If you have any further questions, or need any assistance during the course, please don't hesitate to contact me or drop me an email and I will get back to you at the earliest convenience.

Who this course is for
Beginner and pre-intermediate React / Nextjs developers. Perhaps you know vanilla React but you are not familiar with Nextjs or you are a complete beginner. Intermediates may also find the map and graph information useful too.

Homepage


6.next.jscovid19websiu8k0q.jpg


Naturally Boost Your Immunity vs. COVID-19 & other diseases

photo2021060823014584jty.jpg


Naturally Boost Your Immunity vs. COVID-19 & other diseases
Created by Stanbridge Education | Published 6/2021
Duration: 47m | 4 sections | 17 lectures | Video: 1280x720, 44 KHz | 482 MB
Genre: eLearning | Language: English + Sub

Learn how Vitamin D from supplements, food and sunlight can boost your immune system, and protect you from diseases.


What you'll learn
Learn recent science-backed facts about the relationhip between Vitamin D and COVID-19, and other diseases.
Learn how VItamin D can help boost your immune system, and help you fight off COVID-19.
Learn how to test and check your Vitamin D status.
Learn about the different ways you can increase your Vitamin D status.
Learn what are the causes and symptoms of Vitamin D deficiency.

Requirements
No prerequites for this course. Just a willingness to learn about immunity and Vitamin D.

Description
Are you worried about catching COVID-19 or infections in general? The best way to prevent this may not be through medication or vaccines. Vitamin D is an extremely powerful, natural, immune booster and immuno-regulator which has many important functions for general health, bone density and strength, resistance to infections (COVID, etc...), cancers, and more...
In this FREE course you will learn simple, natural, strategies to boost your immune system with Vitamin D, and become stronger and healthier without any vaccine or medication. What I will teach you in this course is completely science-backed and fact-check but it is not academic, it is 100% practical, and it comes directly from my own experience with trying to stay healthy and optimizing my immune system over the past several years.
Learn how Vitamin D can help you boost your immune system
Understand risks and symptoms associated with low Vitamin D
Learn why a large majority of people worldwide are Vitamin D deficient, and are at risk of catching infections and all sorts of diseases
Decrease your chances of getting sick with COVID-19 and other viruses (flu, etc...)
Learn How to Boost Your Immune Strength with Scientifically Proven Strategies
Increase your energy, get stronger and healthier
Strengthen your immunity with nutrition, sunlight, and supplements

4.vitamindsupplementsfpkrw.jpg


Learn data science - covid-19 and cholera pandemic projects

imxh76upv8le4zlung8fixhjvm.jpg


Learn data science - covid-19 and cholera pandemic projects
MP4 | Video: h264, 1280x720 | Audio: AAC, 44.1 KHz, 2 Ch
Genre: eLearning | Language: English + srt | Duration: 39 lectures (10h 7m) | Size: 2.7 GB

Learn data science using python, plotly and leaflet

What you'll learn:
Introduction to Data Visualisation
Data Types and Chart Types
Data Visaulization in Plotly
COVID Visualization in Plotly
Plotting Geographical Data in Plotly
John's Cholera Graph
Scientific and Statistical Plots and animation
Interactive Maps using Leaflet

Requirements
Basic math skills
Basic to Intermediate Python Skills


Description
This is a course for data visualization lovers.

It has been prepared with practical exercises of the current context for its better understanding and application in a 10 intensive hours.

In a first section, the methodological principles on data viz and graphic display techniques are explained. As an exercise, the extraction and deployment of COVID-19 data using python, Plotly and express submodule is developed.

Additionally, the course includes the geospatial application for the representation of geographic data using Plotly's methods, and as an exercise the data from John Snow's research on cholera is reconstructed.

Finally, scientific and statistical graphics and their display through animation code are explored. As a final project, the Leaflet code is used to explore interactive maps.

Who this course is for
developers
gis and geospatial users
data researchers
Anyone interested in learning more about python, data science, or data visualizations
Anyone interested about the rapidly expanding world of data science

Homepage


003updatingandcustomie9kml.jpg


ArchViz Artist - Training Visualizations (Corona)

pglvs9y8npwy12o9t3nm00ykak.jpg


ArchViz Artist - Training Visualizations (Corona)
Video: 1920x1080, .mp4, 25 fps | Audio: AAC-LC, 253 kb/s 2 channels, 48.0 KHz | Genre: eLearning
Software: 3Ds Max | Duration: 6hr+ | Language: English | File size: 4.6 GB

We will teach you the best of the best practices we use every day to create our images. You will save years of learning the wrong techniques and unnecessary things. Working as a 3d artist can give you a lot of opportunities. The true beauty of this job is that you can make it fit the lifestyle you dream of. If you want to have a stable, safe life, you can choose a full-time job in one of the architectural visualization studios around the world.

Homepage


part1cameras1ojte.jpg


Facilities Management: Returning to the Workplace Post-COVID

nm27tnuis3w6vcor0kif1p8k6d.jpg


Facilities Management: Returning to the Workplace Post-COVID
Duration: 51m 54s | MP4 | Video: AVC, 1280x720 30 fps | Audio: AAC, 48 KHz, 2 Ch | Size: 402 MB
Skill Level: Intermediate | Genre: eLearning | Language: English

In some areas of the world, the pandemic is starting to get under control and companies are contemplating a return to the workplace. The ability to do so safely is dependent on many factors: the existing physical space, work functions, and local attitudes and expectations. Facility managers need to assess the new normal and develop strategies for changes to the built environment. This course with Jim Rogers-a recognized leader in the fields of construction management and occupational safety and health-provides practical strategies for evaluating your current systems and spaces, making changes, and managing ongoing health and safety issues. Learn how to deal with reduced room capacity, alter conference rooms, make improvements to your HVAC system, and more. With these guidelines, you can ensure your company is making the workplace as safe and secure as possible for your employees.

Homepage


08hybridmeetingsrequipuk9u.jpg


Data Science:Covid-19 Data Analysis Visualization Deployment

e28lzq4ewnmwo93bwbhlbmxjt9.jpg


Data Science:Covid-19 Data Analysis Visualization Deployment
MP4 | Video: h264, 1280x720 | Audio: AAC, 44.1 KHz, 2 Ch
Genre: eLearning | Language: English + srt | Duration: 21 lectures (1h 57m) | Size: 547.5 MB

A practical hands on data science Project on Covid-19 Data Analysis, Visualization(using Plotly Express) & Deployment

What you'll learn:
Data Analysis and Understanding
Data Preparation
Performing Feature Engineering
Learn to create Plotly Bubble and Bar Charts
Folium to visualize the data on world map
Pushing your notebooks to GitHub repository
Deploying your project on Heroku Platform

Requirements
Very Basic knowledge of Python
Basic knowledge on Git


Description
This course is about Data Analysis, Visualization on COVID19 data (from authentic and reputed source which is updated daily) & Deployment. This course will teach you everything you need to know from Data Analysis Visualization to deploying it on Cloud platforms.

This course will walk you through the initial data analysis and understanding, data preparation and feature engineering techniques. We will use Plotly which helps us in creating beautiful graphs, hence we will be learning to use Plotly for data visualization mainly we will use Bubble Charts, Bar Charts and Line Plots.

We will also learn techniques to create an interactive feature which will help us to interact with our graphs, changing value at runtime, this will help the users to better interact and play around with the data real time.

We will learn to plot the COVID19 data on world map.

At the end we will learn to deploy the same on Cloud.

Please note that this is a hands on course that means I will code and then you will code.

I have split and segregated the entire course in Tasks below, for ease of understanding of what will be covered.

Task 1 : Importing Libraries.

Task 2 : Loading the data from source (the data source is updated every 24 hours)

Task 3 : Data Understanding

Task 4 : Data Preparation

Task 5 : Extracting the overall worldwide status counts.

Task 6 : Performing Feature Engineering.

Task 7 : Aggregating and visualizing the top n countries having highest new confirmed cases using Plotly Bubble Charts.

Task 8 : Aggregating and visualizing the top n countries having highest new death cases using Plotly Bubble Charts.

Task 9 : Aggregating and visualizing the top n countries having highest new recovered cases using Plotly Bubble Charts.

Task 10 : Visualizing the trend of confirmed cases over time using Plotly Line Charts.(Option to select country from drop down)

Task 11 : Visualizing the trend of death cases over time using Plotly Line Charts.(Option to select country from drop down)

Task 12 : Visualizing the trend of recovered cases over time using Plotly Line Charts.(Option to select country from drop down)

Task 13 : Table chart to showcase the top n countries (where n can be changed at chart level) sorted by confirmed cases in Descending order.

Task 14 : Table chart to showcase the Confirmed/Death/Recovered/Active cases for a country (where the country name can be changed at UI level).

Task 15 : Visualizing the top n worst hit countries (where n can be changed at chart level) with respect to confirmed cases in descending order using Plotly Bar Charts.

Task 16 : Visualizing the top n worst hit countries (where n can be changed at chart level) with respect to death cases in descending order using Plotly Bar Charts.

Task 17 : Visualizing the top n worst hit countries (where n can be changed at chart level) with respect to active cases in descending order using Plotly Bar Charts.

Task 18 : Visualizing the top n countries (where n can be changed at chart level) with respect to recovered cases in descending order using Plotly Bar Charts.

Task 19 : Visualizing the global spread of COVID19 on world map.

Task 20 : Preparing a separate notebook for COVID19 Dashboard containing only the data analysis and visualization graphs.

Task 21 : What is Voila and Installation steps.

Task 22 : How to run your notebook on Voila Server in your local machine.

Task 23 : Pushing your project to GitHub repository.

Task 23 : Hosting your project on Heroku Platform for free.

Data Analysis and Visualization is the most demanded skill of the 21st century and this skill can be yours just for the price of lunch.

You will receive :

1. Certificate of completion from AutomationGig.

2. The Jupyter notebook are provided at the end of the course in the resource section.

3. All other supporting project files are provided at the end of the course in the resource section.

So what are you waiting for?

Grab a cup of coffee, click on the ENROLL NOW Button and start learning the most demanded skill of the 21st century. We'll see you inside the course!

Happy Learning !!

Who this course is for
Students and professionals who want to learn Data Analysis and Visualization
Students and professionals who is interested in learning Plotly
Anyone who is interested in visualizaing real and authentic COVID19 data from reputed source
Professionals who knows data analysis but wants to deploy their data analysis visualizations on cloud

Homepage


005datavisualizationogyj61.jpg


Creating a Google COVID-19 Mobility Dashboard in Tableau

ca0rsdcqspxkdayz6rf5ypxjqq.jpg


Creating a Google COVID-19 Mobility Dashboard in Tableau
MP4 | h264, 1280x720 | Lang: English | Audio: aac, 44100 Hz | 1h 49m | 1.11 GB


What you'll learn
How to create a Professional Dashboards in Tableau
Design, Formatting and Layouts
Requirements
Tableau Desktop / Tableau Public Installed
6-12 Months of Tableau Desktop Experience

Description
Tableau Desktop is often referred to as the Gold Standard for Data Visualization, Data Discovery and Self-Service Data Analytics, and caters for all users from IT Practitioners, to Data Scientists, to Data Consumers.

In this course, we are going to go through all the steps (data acquisition to a polished dashboard) to create our Google COVID-19 Mobility Dashboard in Tableau. It is not just about building the dashboard, however interesting that may be, but it is more about learning my method (and the small details) for creating such dashboards; these lessons are universal and can be applied to add a little quality to all of your other dashboards; if anything, you will have an awesome dashboard at the end of the course.

Topics:

Data Acquisition (Understanding and exploring Google Mobility Data, and loading this into Tableau)

Building our Worksheets (creating the individual worksheets, leveraging icons, colours, duplicating the worksheets, and creating several calculations to support our insights)

Assembling our Dashboard (using Containers for pixels perfect formatting, mobile layouts and toggle worksheets using parameters)

Note: This is not a course on learning the fundamentals of Tableau, but rather how you apply your skills in Tableau, you should have a working knowledge of Tableau prior to attending this course.


Who this course is for:
Anyone who wants to be inspired

Homepage


010movingaverageworkscwjwh.jpg


Coursera - COVID-19 Contact Tracing

cit7qc9wvju5lwhjgjoxfvpjtr.png


Coursera - COVID-19 Contact Tracing
MP4 | Video: 960x540 | Audio: AAC, 44.1Khz , 2ch | Duration: 7 hours | Language: English | 455 MB

The COVID-19 crisis has created an unprecedented need for contact tracing across the country, requiring thousands of people to learn key skills quickly. The job qualifications for contact tracing positions differ throughout the country and the world, with some new positions open to individuals with a high school diploma or equivalent.

In this introductory course, students will learn about the science of SARS-CoV-2 , including the infectious period, the clinical presentation of COVID-19, and the evidence for how SARS-CoV-2 is transmitted from person-to-person and why contact tracing can be such an effective public health intervention. Students will learn about how contact tracing is done, including how to build rapport with cases, identify their contacts, and support both cases and their contacts to stop transmission in their communities. The course will also cover several important ethical considerations around contact tracing, isolation, and quarantine. Finally, the course will identify some of the most common barriers to contact tracing efforts -- along with strategies to overcome them.

02naturalhistoryofsariikbq.jpg


Coursera - COVID-19 Contact Tracing For Nursing Professionals

77puywprgphrcssgncvpx8dj4o.png


Coursera - COVID-19 Contact Tracing For Nursing Professionals
MP4 | Video: 958x540 | Audio: AAC, 44.1Khz , 2ch | Duration: 2 hours | Language: English | 150 MB

This nursing continuing professional development activity was approved by the Texas Nurses Association, an accredited approver by the American Nurses Credentialing Center's Commission on Accreditation. What You Will Learn
-Identify the signs, symptoms, modes of transmission and epidemiology of COVID-19
-Characterize underlying risk factors experienced by vulnerable groups that predisposes to COVID-19 and available resources for high risk communities
-Describe the purpose of contact tracing, the context in which it is conducted, and identify challenges and effective communication strategies

The effects of the current COVID-19 pandemic have disproportionately affected certain population groups. This course provides an overview of the far-reaching impact of COVID-19 and presents contact tracing as a tool to mitigate the spread of the disease for nurses in Texas. Contact tracers are critically needed to help state and local health departments, particularly in large and diverse states such as Texas.

01contacttracing101s3tkgx.jpg


Corona COVID 19 Vaccine in COVID 19 Positive Patient

00856c80bzjez.jpg


Corona COVID 19 Vaccine in COVID 19 Positive Patient
Created by A Power Coding APC : Medical Doctor & Coder | Published 5/2021
Duration: 32m | 8 sections | 8 lectures | Video: 1280x720, 44 KHz | 231 MB
Genre: eLearning | Language: English + Sub

Are you COVID 19 Positive? Should you Vaccinate? : Post Infection, Types of Vaccine and Recommendations simplified


What you'll learn
Are you COVID 19 Positive? Should you Vaccinate?

Requirements
None

Description
Welcome to A Power Coding!
COVID19 Pandemic is a term now a well-known phenomenon.
The Corona Virus disease has affected 160,450,504 people worldwide. This Pandemic is widely affecting the lives of many and the resolution seems a bit more complex. During these tough times, there are several ways of protecting yourself and your loved ones. One such way is the COVID19 Vaccination. Till May 2021, 666.98 Million people have been vaccinated out of 7865.40 Million Population. When it comes to Vaccination, there are still some challenges.
In this session, you will learn all the details of the current COVID19 Vaccination guidelines. This is made to simplify the guidelines for ease of understanding. Please use this information for your benefit with discretion and in consideration of the Local Health Regulatory bodies' recommendations. Remember to follow your health regulator's advice when in doubt.
During this session, I will brief you about the current trends in Vaccination and simplify the cases for you. This will include Post COVID Vaccine, Female Vaccination, Types, and Efficacy of vaccine.
This briefly will also include CPT Coding Guidelines.
\n
Section includes
Severe Acute Respiratory Syndrome Corona Virus 2 (SARS-CoV-2)
COVID19 Symptoms What to do during the symptomatic phase?
Post Infection
Infection After Vaccination
Second Vaccine dose time
Re-Infection
Vaccination in Females
Vaccine prevents DISEASE
CPT Codes
COVID-19 Vaccine Types
o Pfizer
o Moderna
o Astra Zeneca
o Janssen
o Covaxin
o Covishield
o Sputnik V
o Efficacy

1.vaccinepreventsdisec4knd.jpg


Zurück
Oben Unten