



Murtadoc
MyBoerse.bz Pro Member
EJ Technologies JProfiler v11.1 Build 11134 Win & MacOS
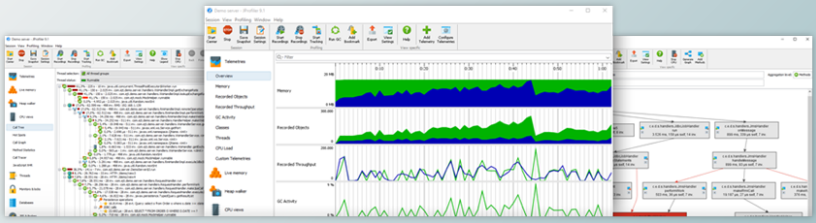
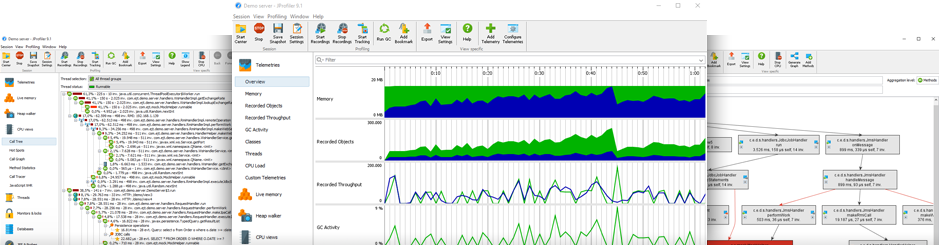
Die intuitive Benutzeroberfläche von JProfiler hilft Ihnen, Leistungsengpässe zu beheben.
Speicherlecks aufspüren und Threading-Probleme verstehen.
Wenn es um die Profilerstellung geht, ist nur das beste Werkzeug gut genug.
Lesen Sie unten, was JProfiler zur ersten Wahl für die Profilerstellung Ihrer Anwendungen auf der JVM macht:
AUSSERGEWÖHNLICHE BENUTZERFREUNDLICHKEIT
Wenn Sie ein Profil erstellen, benötigen Sie das leistungsstärkste Tool, das Sie erhalten können. Gleichzeitig möchten Sie keine Zeit damit verbringen, den Umgang mit dem Tool zu erlernen. JProfiler ist genau das: einfach und leistungsstark zugleich. Das Konfigurieren von Sitzungen ist unkompliziert. Integrationen von Drittanbietern erleichtern den Einstieg und die Darstellung von Profildaten erfolgt auf natürliche Weise. JProfiler wurde auf allen Ebenen sorgfältig entwickelt, um Ihnen den Einstieg in die Lösung Ihrer Probleme zu erleichtern.
DATENBANKPROFILIERUNG FÜR JDBC, JPA UND NOSQL
Datenbankaufrufe sind die Hauptgründe für Leistungsprobleme in Geschäftsanwendungen. JProfilers JDBC- und JPA / Hibernate-Tests sowie die NoSQL-Tests für MongoDB, Cassandra und HBase zeigen die Gründe für den langsamen Datenbankzugriff und wie langsame Anweisungen von Ihrem Code aufgerufen werden. Von der JDBC-Zeitachsenansicht, in der alle JDBC-Verbindungen mit ihren Aktivitäten angezeigt werden, über die Hotspot-Ansicht, in der langsame Anweisungen zu verschiedenen Telemetrieansichten und eine Liste einzelner Ereignisse angezeigt werden, sind die Datenbankprüfungen ein wesentliches Werkzeug, um einen Einblick in Ihre Datenbankebene zu erhalten .
AUSGEZEICHNETE UNTERSTÜTZUNG FÜR JAVA ENTERPRISE EDITION
Spezielle Unterstützung für JEE ist in den meisten Ansichten von JProfiler vorhanden. In der JEE-Aggregationsebene sehen Sie beispielsweise die Aufrufstruktur in Bezug auf die JEE-Komponenten in Ihrer Anwendung. Außerdem wird der Anrufbaum für jede Anforderungs-URI aufgeteilt. Darüber hinaus fügt JProfiler eine semantische Ebene über die Low-Level-Profiling-Daten hinzu, z. B. JDBC-, JPA / Hibernate-, JMS- und JNDI-Aufrufe, die in den CPU-Profiling-Ansichten angezeigt werden. Mit seiner JEE-Unterstützung schließt JProfiler die Lücke zwischen einem Code-Profiler und einem übergeordneten JEE-Überwachungstool.
PROFILIERENDE DATEN AUF HÖHEREM NIVEAU
JProfiler verfügt über eine Reihe von Tests, mit denen Sie übergeordnete Daten von interessanten Subsystemen in der JRE anzeigen können. Neben den Java EE-Subsystemen wie JDBC, JPA / Hibernate, JSP / Servlets, JMS, Webservices und JNDI bietet JProfiler auch allgemeine Informationen zu RMI-Aufrufen, Dateien, Sockets und Prozessen. Jede dieser Sonden verfügt über einen eigenen Satz nützlicher Ansichten, mit denen Sie allgemeine Einblicke erhalten, Leistungsprobleme hervorheben und einzelne Ereignisse nachverfolgen können. Darüber hinaus sind alle diese Ansichten auch für Ihre eigenen benutzerdefinierten Probes verfügbar, die Sie im laufenden Betrieb in JProfiler konfigurieren können.
STELLARE ANALYSE VON SPEICHERLECKEN
Das Auffinden eines Speicherverlusts kann ohne das richtige Werkzeug unmöglich sein. Der Heap Walker von JProfiler bietet Ihnen eine intuitive Benutzeroberfläche, mit der Sie sowohl einfache als auch komplexe Speicherprobleme lösen können. 5 verschiedene Ansichten und viele Inspektionen zeigen verschiedene Aspekte des aktuellen Objektsatzes. In jeder Ansicht erhalten Sie wichtige Einblicke in die ausgewählten Objekte und können zu verschiedenen Objektgruppen wechseln. Fragen, warum Objekte nicht über den Müll gesammelt werden, werden mit einem einzigen Mausklick beantwortet.
UMFASSENDE QA-FÄHIGKEITEN
JProfiler eignet sich ideal als QS-Tool, sowohl während der Entwicklung als auch für engagierte QS-Teams. Die umfangreichen Funktionen für Schnappschussvergleiche erleichtern die Verfolgung des Fortschritts. JProfiler bietet starke Unterstützung für Befehlszeilenoperationen. Dies beinhaltet die Möglichkeit, Schnappschussdaten zu profilieren, zu exportieren und Schnappschussvergleiche über die Befehlszeile zu erstellen. Mit den in JProfiler enthaltenen Ant-Tasks können Sie alle Befehlszeilenvorgänge von Ihrem Build-Skript aus ausführen.
BREITESTE UNTERSTÜTZUNG FÜR PLATTFORMEN, IDES UND ANWENDUNGSSERVER
JProfiler integriert sich in Ihre Umgebung: Wir bieten native Agentenbibliotheken für eine Vielzahl von Plattformen, sowohl für 32-Bit- als auch für 64-Bit-JVMs. Durch die Integration in alle gängigen IDEs wird die Profilerstellung während der Entwicklung so einfach wie das Ausführen Ihrer Anwendung. Die große Anzahl von Integrationsassistenten für nahezu alle Anwendungsserver auf dem Markt sorgt dafür, dass Sie mit wenigen Klicks loslegen und nicht erst die Dokumentation lesen müssen.
NIEDRIG ÜBERHAUPT
JProfiler zeichnet Daten nur dann auf, wenn Sie sie benötigen. Tatsächlich können Sie Ihre Anwendung mit dem JProfiler-Agenten starten und die JProfiler-GUI zu einem späteren Zeitpunkt anhängen. Wenn Sie keine Daten aufzeichnen, ist der Overhead extrem gering. Das nennen wir On-Demand-Profiling. Ausnahmslos gibt es eine Menge Dinge, die Sie in einem erweiterten Profiler anpassen können. JProfiler zeigt Ihnen, wie sich Ihre Profileinstellungen auf die Leistung auswirken, und bietet Vorlagen, mit denen Sie Profileinstellungen für allgemeine Anwendungsfälle schnell auswählen können.
374.5 MB
zip archive
Download Link:
Die intuitive Benutzeroberfläche von JProfiler hilft Ihnen, Leistungsengpässe zu beheben.
Speicherlecks aufspüren und Threading-Probleme verstehen.
Wenn es um die Profilerstellung geht, ist nur das beste Werkzeug gut genug.
Lesen Sie unten, was JProfiler zur ersten Wahl für die Profilerstellung Ihrer Anwendungen auf der JVM macht:
AUSSERGEWÖHNLICHE BENUTZERFREUNDLICHKEIT
Wenn Sie ein Profil erstellen, benötigen Sie das leistungsstärkste Tool, das Sie erhalten können. Gleichzeitig möchten Sie keine Zeit damit verbringen, den Umgang mit dem Tool zu erlernen. JProfiler ist genau das: einfach und leistungsstark zugleich. Das Konfigurieren von Sitzungen ist unkompliziert. Integrationen von Drittanbietern erleichtern den Einstieg und die Darstellung von Profildaten erfolgt auf natürliche Weise. JProfiler wurde auf allen Ebenen sorgfältig entwickelt, um Ihnen den Einstieg in die Lösung Ihrer Probleme zu erleichtern.
DATENBANKPROFILIERUNG FÜR JDBC, JPA UND NOSQL
Datenbankaufrufe sind die Hauptgründe für Leistungsprobleme in Geschäftsanwendungen. JProfilers JDBC- und JPA / Hibernate-Tests sowie die NoSQL-Tests für MongoDB, Cassandra und HBase zeigen die Gründe für den langsamen Datenbankzugriff und wie langsame Anweisungen von Ihrem Code aufgerufen werden. Von der JDBC-Zeitachsenansicht, in der alle JDBC-Verbindungen mit ihren Aktivitäten angezeigt werden, über die Hotspot-Ansicht, in der langsame Anweisungen zu verschiedenen Telemetrieansichten und eine Liste einzelner Ereignisse angezeigt werden, sind die Datenbankprüfungen ein wesentliches Werkzeug, um einen Einblick in Ihre Datenbankebene zu erhalten .
AUSGEZEICHNETE UNTERSTÜTZUNG FÜR JAVA ENTERPRISE EDITION
Spezielle Unterstützung für JEE ist in den meisten Ansichten von JProfiler vorhanden. In der JEE-Aggregationsebene sehen Sie beispielsweise die Aufrufstruktur in Bezug auf die JEE-Komponenten in Ihrer Anwendung. Außerdem wird der Anrufbaum für jede Anforderungs-URI aufgeteilt. Darüber hinaus fügt JProfiler eine semantische Ebene über die Low-Level-Profiling-Daten hinzu, z. B. JDBC-, JPA / Hibernate-, JMS- und JNDI-Aufrufe, die in den CPU-Profiling-Ansichten angezeigt werden. Mit seiner JEE-Unterstützung schließt JProfiler die Lücke zwischen einem Code-Profiler und einem übergeordneten JEE-Überwachungstool.
PROFILIERENDE DATEN AUF HÖHEREM NIVEAU
JProfiler verfügt über eine Reihe von Tests, mit denen Sie übergeordnete Daten von interessanten Subsystemen in der JRE anzeigen können. Neben den Java EE-Subsystemen wie JDBC, JPA / Hibernate, JSP / Servlets, JMS, Webservices und JNDI bietet JProfiler auch allgemeine Informationen zu RMI-Aufrufen, Dateien, Sockets und Prozessen. Jede dieser Sonden verfügt über einen eigenen Satz nützlicher Ansichten, mit denen Sie allgemeine Einblicke erhalten, Leistungsprobleme hervorheben und einzelne Ereignisse nachverfolgen können. Darüber hinaus sind alle diese Ansichten auch für Ihre eigenen benutzerdefinierten Probes verfügbar, die Sie im laufenden Betrieb in JProfiler konfigurieren können.
STELLARE ANALYSE VON SPEICHERLECKEN
Das Auffinden eines Speicherverlusts kann ohne das richtige Werkzeug unmöglich sein. Der Heap Walker von JProfiler bietet Ihnen eine intuitive Benutzeroberfläche, mit der Sie sowohl einfache als auch komplexe Speicherprobleme lösen können. 5 verschiedene Ansichten und viele Inspektionen zeigen verschiedene Aspekte des aktuellen Objektsatzes. In jeder Ansicht erhalten Sie wichtige Einblicke in die ausgewählten Objekte und können zu verschiedenen Objektgruppen wechseln. Fragen, warum Objekte nicht über den Müll gesammelt werden, werden mit einem einzigen Mausklick beantwortet.
UMFASSENDE QA-FÄHIGKEITEN
JProfiler eignet sich ideal als QS-Tool, sowohl während der Entwicklung als auch für engagierte QS-Teams. Die umfangreichen Funktionen für Schnappschussvergleiche erleichtern die Verfolgung des Fortschritts. JProfiler bietet starke Unterstützung für Befehlszeilenoperationen. Dies beinhaltet die Möglichkeit, Schnappschussdaten zu profilieren, zu exportieren und Schnappschussvergleiche über die Befehlszeile zu erstellen. Mit den in JProfiler enthaltenen Ant-Tasks können Sie alle Befehlszeilenvorgänge von Ihrem Build-Skript aus ausführen.
BREITESTE UNTERSTÜTZUNG FÜR PLATTFORMEN, IDES UND ANWENDUNGSSERVER
JProfiler integriert sich in Ihre Umgebung: Wir bieten native Agentenbibliotheken für eine Vielzahl von Plattformen, sowohl für 32-Bit- als auch für 64-Bit-JVMs. Durch die Integration in alle gängigen IDEs wird die Profilerstellung während der Entwicklung so einfach wie das Ausführen Ihrer Anwendung. Die große Anzahl von Integrationsassistenten für nahezu alle Anwendungsserver auf dem Markt sorgt dafür, dass Sie mit wenigen Klicks loslegen und nicht erst die Dokumentation lesen müssen.
NIEDRIG ÜBERHAUPT
JProfiler zeichnet Daten nur dann auf, wenn Sie sie benötigen. Tatsächlich können Sie Ihre Anwendung mit dem JProfiler-Agenten starten und die JProfiler-GUI zu einem späteren Zeitpunkt anhängen. Wenn Sie keine Daten aufzeichnen, ist der Overhead extrem gering. Das nennen wir On-Demand-Profiling. Ausnahmslos gibt es eine Menge Dinge, die Sie in einem erweiterten Profiler anpassen können. JProfiler zeigt Ihnen, wie sich Ihre Profileinstellungen auf die Leistung auswirken, und bietet Vorlagen, mit denen Sie Profileinstellungen für allgemeine Anwendungsfälle schnell auswählen können.
374.5 MB
zip archive
Download Link: