


• Regeln für den Video-Bereich:

    In den Börsenbereich gehören nur Angebote die bereits den Allgemeinen Regeln entsprechen.

    Einteilung

    - Folgende Formate gehören in die angegeben Bereiche:
    - Filme: Encodierte Filme von BluRay, DVD, R5, TV, Screener sowie Telesyncs im Format DivX, XviD und x264.
    - DVD: Filme im Format DVD5, DVD9 und HD2DVD.
    - HD: Encodierte Filme mit der Auflösung 720p oder darüber von BluRay, DVD, R5, TV, Screener sowie Telesyncs im Format x264.
    - 3D: Encodierte Filme von BluRay, die in einem 3D Format vorliegen. Dies gilt auch für Dokus, Animation usw.
    - Serien: Cartoon/Zeichentrick, Anime, Tutorials, Dokumentationen, Konzerte/Musik, Sonstiges sind demnach in die entsprechenden Bereiche einzuordnen, auch wenn sie beispielsweise im High Definition-Format oder als DVD5/DVD9/HD2DVD vorliegen. Ausnahme 3D.
    - Bereich Englisch: Englische Releases gehören immer in diesen Bereich.
    - Bereich Talk: Der Bereich, in dem über die Releases diskutiert werden kann, darf, soll und erwünscht ist.


    Angebot/Beitrag erstellen

    - Ein Beitrag darf erst dann erstellt werden, wenn der Upload bei mindestens einem OCH komplett ist. Platzhalter sind untersagt.
    - Bei einem Scenerelease hat der Threadtitel ausschließlich aus dem originalen, unveränderten Releasenamen zu bestehen. Es dürfen keine Veränderungen wie z.B. Sterne, kleine Buchstaben o.ä. vorgenommen werden. Ausnahme Serienbörse:
    - Bei einem Sammelthread für eine Staffel entfällt aus dem Releasename natürlich der Name der Folge. Beispiel: Die Simpsons S21 German DVDRip XviD - ITG
    - Dementsprechend sind also u.a. verboten: Erweiterungen wie "Tipp", "empfehlenswert", "only", "reup", usw. / jegliche andere Zusatzinformation oder Ergänzung, welche nicht in obiger Beschreibung zu finden ist.

    Aufbau des Angebots und Threadtitel

    Der Titel nach folgendem Muster erstellt zu werden. <Name> [3D] [Staffel] [German] <Jahr> <Tonspur> [DL] [Auflösung] <Quelle> <Codec> - <Group>
    Beispiel: The Dark Knight German 2008 AC3 DVDRip XviD - iND
    Beispiel: The Dark Knight 2008 DTS DL BDRip x264 - iND
    Beispiel: The Dark Knight 2008 AC3 DL BDRip XviD - iND
    Beispiel: The Dark Knight German 2008 AC3 720p BluRay x264 iND
    Beispiel: The Dark Knight 2008 DTS DL 1080p BluRay x264 iND
    Beispiel: Die Simpsons S01 German AC3 DVDRip XviD iND
    Beispiel: Die Simpsons S20 German AC3 720p BluRay x264 iND
    Beispiel: Sword Art Online II Ger Sub 2014 AAC 1080p WEBRip x264 - peppermint
    Entsprechend sind also u.a. verboten: Sonderzeichen wie Klammern, Sterne, Ausrufezeichen, Unterstriche, Anführungszeichen / Erweiterungen wie "Tipp", "empfehlenswert", "only", "reup", usw. / jegliche andere Zusatzinformation oder Ergänzung, welche nicht in obiger Beschreibung zu finden ist
    Ausnahmen hiervon können in den Bereichen geregelt sein.

    Die Beiträge sollen wie folgt aufgebaut werden:
    Überschrift entspricht dem Threadtitel
    Cover
    kurze Inhaltsbeschreibung
    Format, Größe, Dauer sind gut lesbar für Downloader außerhalb des Spoilers zu vermerken
    Nfo sind immer Anzugeben und selbige immer im Spoiler in Textform.
    Sind keine Nfo vorhanden z.B. Eigenpublikationen, sind im Spoiler folgende Dateiinformationen zusätzlich anzugeben :
    Quelle
    Video (Auflösung und Bitrate)
    Ton (Sprache, Format und Bitrate der einzelnen Spuren)
    Untertitel (sofern vorhanden)
    Hosterangabe in Textform außerhalb eines Spoiler mit allen enthaltenen Hostern.
    Bei SD kann auf diese zusätzlichen Dateiinformationen verzichtet werden.

    Alle benötigten Passwörter sind, sofern vorhanden, in Textform im Angebot anzugeben.
    Spoiler im Spoiler mit Kommentaren :"Schon Bedankt?" sind unerwünscht.


    Releases

    - Sind Retail-Release verfügbar, sind alle anderen Variationen untersagt. Ausnahmen: Alle deutschen Retail-Release sind CUT, in diesem Fall sind dubbed UNCUT-Release zulässig.
    - Im Serien-Bereich gilt speziell: Wenn ein Retail vor Abschluss einer laufenden Staffel erscheint, darf diese Staffel noch zu Ende gebracht werden.62
    - Gleiche Releases sind unbedingt zusammenzufassen. Das bedeutet, es ist zwingend erforderlich, vor dem Erstellen eines Themas per Suchfunktion zu überprüfen, ob bereits ein Beitrag mit demselben Release besteht. Ist dies der Fall, ist der bereits vorhandene Beitrag zu verwenden.
    - P2P und Scene Releases dürfen nicht verändert oder gar unter einem iND Tag eingestellt werden.


    Support, Diskussionen und Suche

    - Supportanfragen sind entweder per PN oder im Bereich Talk zu stellen.
    - Diskussionen und Bewertungen sind im Talk Bereich zu führen. Fragen an die Uploader haben ausschließlich via PN zu erfolgen, und sind in den Angeboten untersagt.
    - Anfragen zu Upload-Wünschen sind nur im Bereich Suche Video erlaubt. Antworten dürfen nur auf Angebote von MyBoerse.bz verlinkt werden.


    Verbote

    - Untersagt sind mehrere Formate in einem einzigen Angebotsthread, wie beispielsweise das gleichzeitige Anbieten von DivX/XviD, 720p und 1080p in einem Thread. Pro Format, Release und Auflösung ist ein eigener Thread zu eröffnen.
    - Grundsätzlich ebenso verboten sind Dupes. Uploader haben sich an geeigneter Stelle darüber zu informieren, ob es sich bei einem Release um ein Dupe handelt.
    - Gefakte, nur teilweise lauffähige oder unvollständige Angebote sind untersagt. Dies gilt auch für eigene Publikationen, die augenscheinlich nicht selbst von z.B. einer DVD gerippt wurden. Laufende Serien, bei denen noch nicht alle Folgen verfügbar sind, dürfen erstellt und regelmäßig geupdatet werden.
    - Untersagt sind Angebote, welche nur und ausschließlich in einer anderen Sprache als deutsch oder englisch vorliegen. Ausnahmen sind VORHER mit den Moderatoren zu klären.


    Verstoß gegen die Regeln

    - Angebote oder Beiträge, die gegen die Forenregeln verstoßen, sind über den "Melden"-Button im Beitrag zu melden.
  • Bitte registriere dich zunächst um Beiträge zu verfassen und externe Links aufzurufen.


Grafana (2023) Complete Dashboards + Monitoring

Tutorials

MyBoerse.bz Pro Member
b4ca24906250d196c0793c6311dd08b7.jpeg

Published 2/2023
MP4 | Video: h264, 1280x720 | Audio: AAC, 44.1 KHz
Language: English | Size: 1.83 GB | Duration: 2h 40m
Create complete interactive dashboards in Grafana starting from zero!

What you'll learn
How to create an account and install Grafana.
Integrate Grafana to multiple data sources (Prometheus, Databases, etc).
Data manipulation and analysis with Grafana
Dynamic charts and visualization on Grafana
Interactive Dashboards in Grafana
Alerts and notifications in Grafana
Requirements
There are no previous requirements.
Description
Welcome!This course is designed for anyone who wants to learn about Grafana and system monitoring. The course is aimed at providing hands-on training for students to create interactive dashboards, integrate with various data sources, and perform monitoring functions through alerts and notifications. The course covers the use of Grafana, starting from the basics and progressing to an advanced level. The teaching approach is practical and focused on case studies and screen sharing, making it an effective learning experience.The course covers a range of topics, including:Setting up an account and using local and cloud instances of GrafanaIntegrating Grafana with various data sources, such as Prometheus and databasesData treatment and analysis in GrafanaCreating custom visualizations and chartsBuilding interactive dashboardsConfiguring alerts and notificationsManaging users in GrafanaSQL logicInstalling and understanding the architecture of PrometheusNo prior knowledge of Grafana is required for this course. The steps are demonstrated in a clear, concise and practical manner, with best practice recommendations and tips for using the tool. All features covered in the course can be used with the free version of Grafana and Elephant SQL.Grafana is a widely used open-source solution for monitoring and visualizing data, available in both cloud and local versions. With this Udemy course, students will be equipped with the skills to effectively use Grafana to monitor their systems and make informed decisions based on data insights.
Overview
Section 1: Introduction
Lecture 1 What is Grafana?
Lecture 2 Creating a free Grafana account
Lecture 3 Creating a local Grafana instance
Section 2: First steps on Grafana
Lecture 4 Case study
Lecture 5 What is SQL?
Lecture 6 SQL Expressions - Part 1
Lecture 7 SQL Expressions - Part 2
Lecture 8 Database preparation (Postgree)
Lecture 9 Data Sources - Part 1
Lecture 10 Data Sources - Part 2
Lecture 11 Understanding the Dashboards
Lecture 12 Pannels logic
Lecture 13 Creating a Pannel
Section 3: Visualizations on Grafana
Lecture 14 Charts: Revenue by day - Part 1
Lecture 15 Charts: Revenue by day - Part 2
Lecture 16 Charts: Revenue by product
Lecture 17 Charts: Revenue by country
Section 4: Advanced resources on Grafana
Lecture 18 Alerting on Grafana
Lecture 19 Custom notifications
Lecture 20 Installing Prometheus on Windows
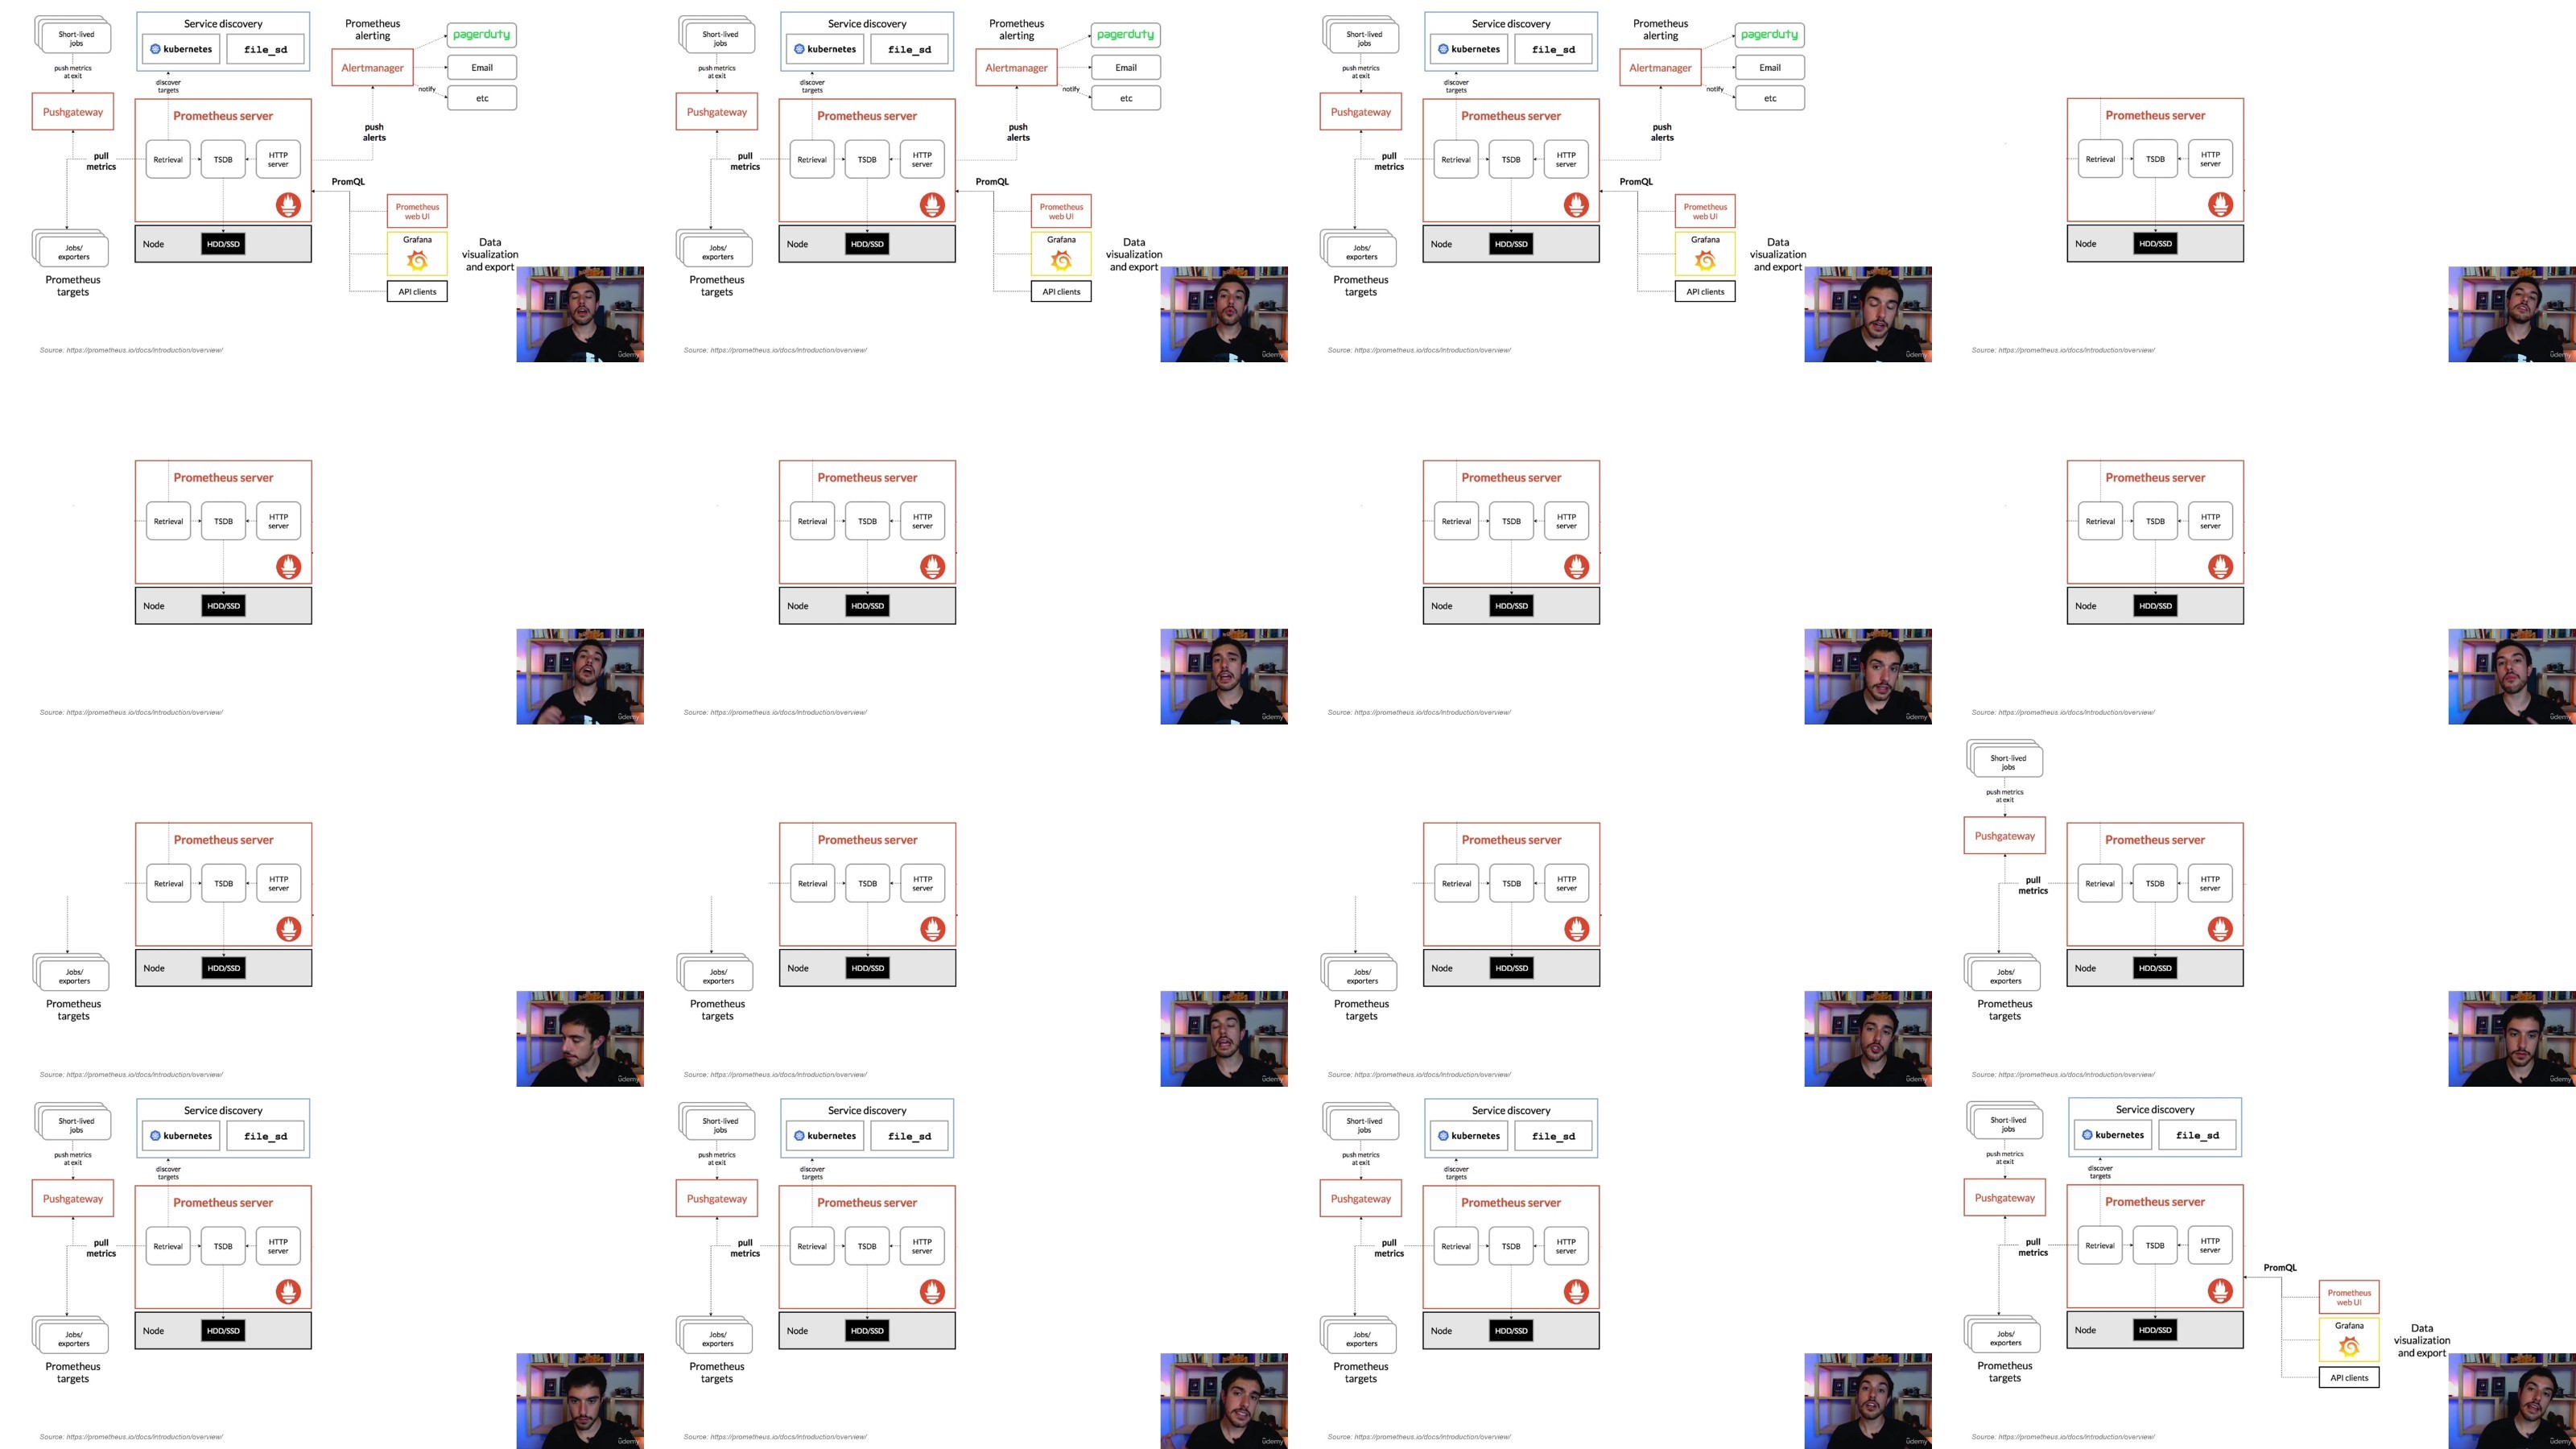
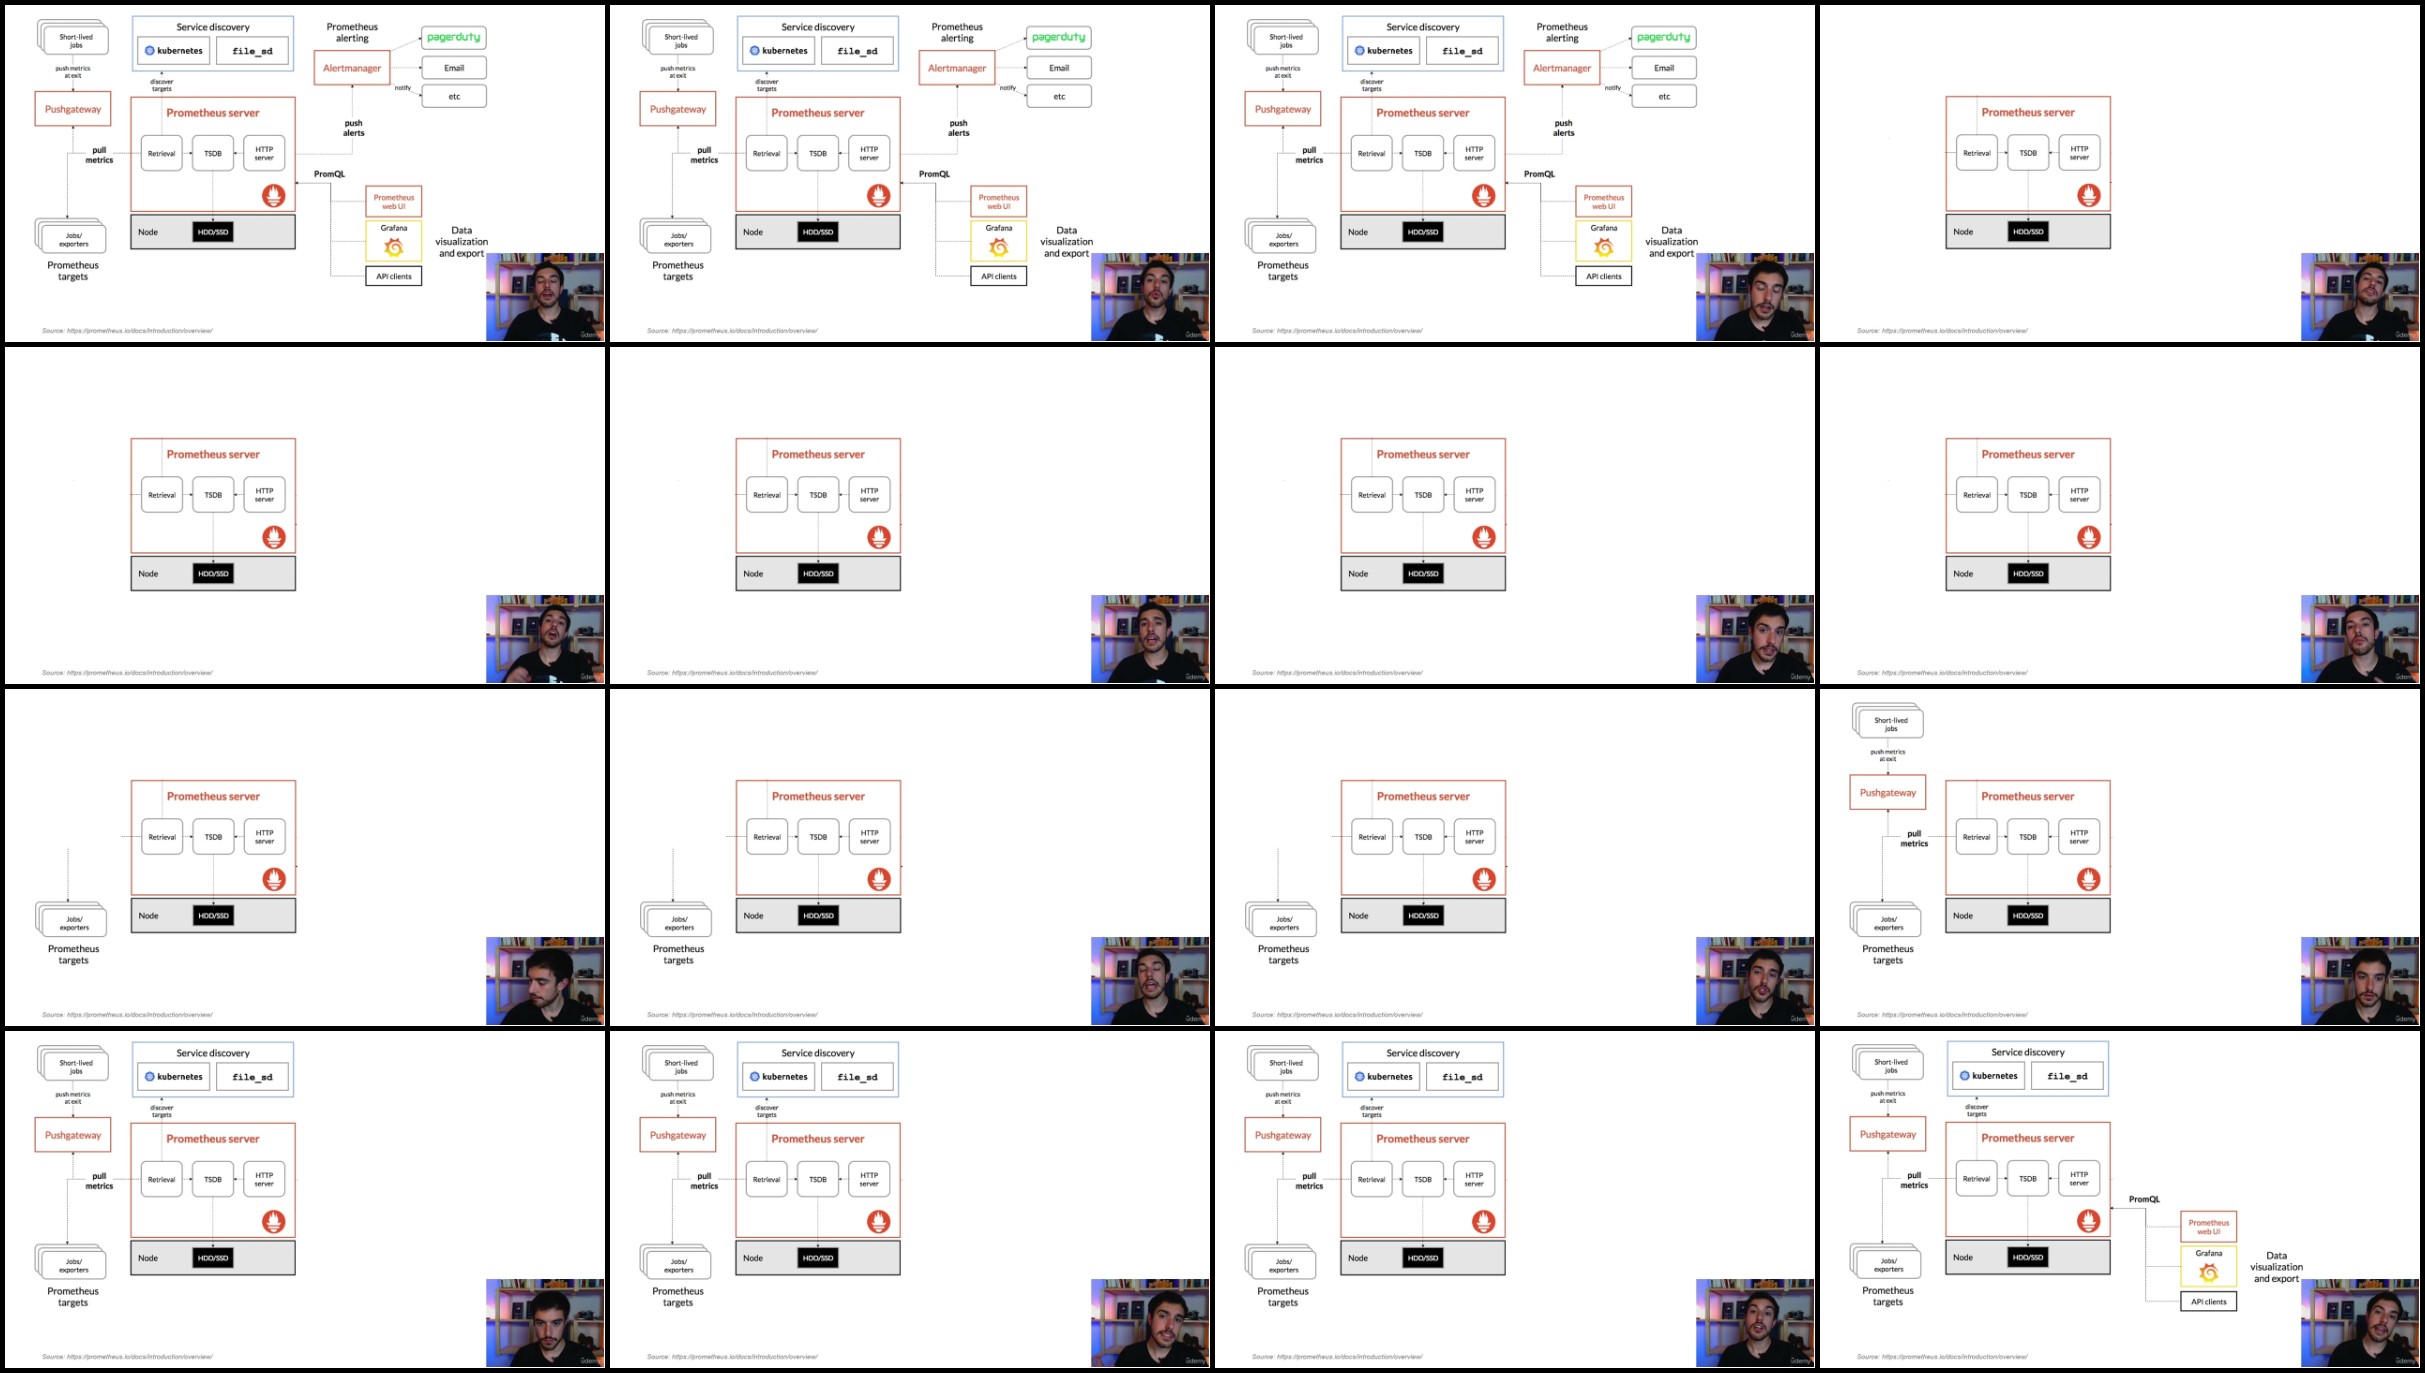
Lecture 21 Prometheus Architecture
Developers.,Software engineers.,Managers.,Data analysts.
Homepage


Recommend Download Link Hight Speed | Please Say Thanks Keep Topic Live
Links are Interchangeable - No Password - Single Extraction
 

5c6cfcb4c4541e0ccdcd3fe2ffce4abb.jpg

Grafana (2023): Complete Dashboards + Monitoring
Published 2/2023
MP4 | Video: h264, 1280x720 | Audio: AAC, 44.1 KHz
Language: English | Size: 1.83 GB | Duration: 2h 40m​

Create complete interactive dashboards in Grafana starting from zero!

What you'll learn

How to create an account and install Grafana.

Integrate Grafana to multiple data sources (Prometheus, Databases, etc).

Data manipulation and analysis with Grafana

Dynamic charts and visualization on Grafana

Interactive Dashboards in Grafana

Alerts and notifications in Grafana

Requirements

There are no previous requirements.

Description

Welcome!This course is designed for anyone who wants to learn about Grafana and system monitoring. The course is aimed at providing hands-on training for students to create interactive dashboards, integrate with various data sources, and perform monitoring functions through alerts and notifications. The course covers the use of Grafana, starting from the basics and progressing to an advanced level. The teaching approach is practical and focused on case studies and screen sharing, making it an effective learning experience.The course covers a range of topics, including:Setting up an account and using local and cloud instances of GrafanaIntegrating Grafana with various data sources, such as Prometheus and databasesData treatment and analysis in GrafanaCreating custom visualizations and chartsBuilding interactive dashboardsConfiguring alerts and notificationsManaging users in GrafanaSQL logicInstalling and understanding the architecture of PrometheusNo prior knowledge of Grafana is required for this course. The steps are demonstrated in a clear, concise and practical manner, with best practice recommendations and tips for using the tool. All features covered in the course can be used with the free version of Grafana and Elephant SQL.Grafana is a widely used open-source solution for monitoring and visualizing data, available in both cloud and local versions. With this Udemy course, students will be equipped with the skills to effectively use Grafana to monitor their systems and make informed decisions based on data insights.

Overview

Section 1: Introduction

Lecture 1 What is Grafana?

Lecture 2 Creating a free Grafana account

Lecture 3 Creating a local Grafana instance

Section 2: First steps on Grafana

Lecture 4 Case study

Lecture 5 What is SQL?

Lecture 6 SQL Expressions - Part 1

Lecture 7 SQL Expressions - Part 2

Lecture 8 Database preparation (Postgree)

Lecture 9 Data Sources - Part 1

Lecture 10 Data Sources - Part 2

Lecture 11 Understanding the Dashboards

Lecture 12 Pannels logic

Lecture 13 Creating a Pannel

Section 3: Visualizations on Grafana

Lecture 14 Charts: Revenue by day - Part 1

Lecture 15 Charts: Revenue by day - Part 2

Lecture 16 Charts: Revenue by product

Lecture 17 Charts: Revenue by country

Section 4: Advanced resources on Grafana

Lecture 18 Alerting on Grafana

Lecture 19 Custom notifications

Lecture 20 Installing Prometheus on Windows

Lecture 21 Prometheus Architecture

Developers.,Software engineers.,Managers.,Data analysts.

fcQTvocu_o.jpg


8078c9c76f2fa66916f733e3e7471fdc.jpg

Grafana (2023): Complete Dashboards + Monitoring
Published 2/2023
MP4 | Video: h264, 1280x720 | Audio: AAC, 44.1 KHz
Language: English | Size: 1.83 GB | Duration: 2h 40m​

Create complete interactive dashboards in Grafana starting from zero!

What you'll learn

How to create an account and install Grafana.

Integrate Grafana to multiple data sources (Prometheus, Databases, etc).

Data manipulation and analysis with Grafana

Dynamic charts and visualization on Grafana

Interactive Dashboards in Grafana

Alerts and notifications in Grafana

Requirements

There are no previous requirements.

Description

Welcome!This course is designed for anyone who wants to learn about Grafana and system monitoring. The course is aimed at providing hands-on training for students to create interactive dashboards, integrate with various data sources, and perform monitoring functions through alerts and notifications. The course covers the use of Grafana, starting from the basics and progressing to an advanced level. The teaching approach is practical and focused on case studies and screen sharing, making it an effective learning experience.The course covers a range of topics, including:Setting up an account and using local and cloud instances of GrafanaIntegrating Grafana with various data sources, such as Prometheus and databasesData treatment and analysis in GrafanaCreating custom visualizations and chartsBuilding interactive dashboardsConfiguring alerts and notificationsManaging users in GrafanaSQL logicInstalling and understanding the architecture of PrometheusNo prior knowledge of Grafana is required for this course. The steps are demonstrated in a clear, concise and practical manner, with best practice recommendations and tips for using the tool. All features covered in the course can be used with the free version of Grafana and Elephant SQL.Grafana is a widely used open-source solution for monitoring and visualizing data, available in both cloud and local versions. With this Udemy course, students will be equipped with the skills to effectively use Grafana to monitor their systems and make informed decisions based on data insights.

Overview

Section 1: Introduction

Lecture 1 What is Grafana?

Lecture 2 Creating a free Grafana account

Lecture 3 Creating a local Grafana instance

Section 2: First steps on Grafana

Lecture 4 Case study

Lecture 5 What is SQL?

Lecture 6 SQL Expressions - Part 1

Lecture 7 SQL Expressions - Part 2

Lecture 8 Database preparation (Postgree)

Lecture 9 Data Sources - Part 1

Lecture 10 Data Sources - Part 2

Lecture 11 Understanding the Dashboards

Lecture 12 Pannels logic

Lecture 13 Creating a Pannel

Section 3: Visualizations on Grafana

Lecture 14 Charts: Revenue by day - Part 1

Lecture 15 Charts: Revenue by day - Part 2

Lecture 16 Charts: Revenue by product

Lecture 17 Charts: Revenue by country

Section 4: Advanced resources on Grafana

Lecture 18 Alerting on Grafana

Lecture 19 Custom notifications

Lecture 20 Installing Prometheus on Windows

Lecture 21 Prometheus Architecture

Developers.,Software engineers.,Managers.,Data analysts.

z36rNrix_o.jpg


74a493b4ec43831a3ff6b6b066d422f9.jpg

Grafana (2023): Complete Dashboards + Monitoring
Published 2/2023
MP4 | Video: h264, 1280x720 | Audio: AAC, 44.1 KHz
Language: English | Size: 1.83 GB | Duration: 2h 40m​

What you'll learn

How to create an account and install Grafana.

Integrate Grafana to multiple data sources (Prometheus, Databases, etc).

Data manipulation and analysis with Grafana

Dynamic charts and visualization on Grafana

Interactive Dashboards in Grafana

Alerts and notifications in Grafana

Requirements

There are no previous requirements.

Description

Welcome!This course is designed for anyone who wants to learn about Grafana and system monitoring. The course is aimed at providing hands-on training for students to create interactive dashboards, integrate with various data sources, and perform monitoring functions through alerts and notifications. The course covers the use of Grafana, starting from the basics and progressing to an advanced level. The teaching approach is practical and focused on case studies and screen sharing, making it an effective learning experience.The course covers a range of topics, including:Setting up an account and using local and cloud instances of GrafanaIntegrating Grafana with various data sources, such as Prometheus and databasesData treatment and analysis in GrafanaCreating custom visualizations and chartsBuilding interactive dashboardsConfiguring alerts and notificationsManaging users in GrafanaSQL logicInstalling and understanding the architecture of PrometheusNo prior knowledge of Grafana is required for this course. The steps are demonstrated in a clear, concise and practical manner, with best practice recommendations and tips for using the tool. All features covered in the course can be used with the free version of Grafana and Elephant SQL.Grafana is a widely used open-source solution for monitoring and visualizing data, available in both cloud and local versions. With this Udemy course, students will be equipped with the skills to effectively use Grafana to monitor their systems and make informed decisions based on data insights.

Overview

Section 1: Introduction

Lecture 1 What is Grafana?

Lecture 2 Creating a free Grafana account

Lecture 3 Creating a local Grafana instance

Section 2: First steps on Grafana

Lecture 4 Case study

Lecture 5 What is SQL?

Lecture 6 SQL Expressions - Part 1

Lecture 7 SQL Expressions - Part 2

Lecture 8 Database preparation (Postgree)

Lecture 9 Data Sources - Part 1

Lecture 10 Data Sources - Part 2

Lecture 11 Understanding the Dashboards

Lecture 12 Pannels logic

Lecture 13 Creating a Pannel

Section 3: Visualizations on Grafana

Lecture 14 Charts: Revenue by day - Part 1

Lecture 15 Charts: Revenue by day - Part 2

Lecture 16 Charts: Revenue by product

Lecture 17 Charts: Revenue by country

Section 4: Advanced resources on Grafana

Lecture 18 Alerting on Grafana

Lecture 19 Custom notifications

Lecture 20 Installing Prometheus on Windows

Lecture 21 Prometheus Architecture

Developers.,Software engineers.,Managers.,Data analysts.

21-Prometheus-Architecture.jpg

 
Zurück
Oben Unten